Overview
 At the top of the page, you can filter analytics by:
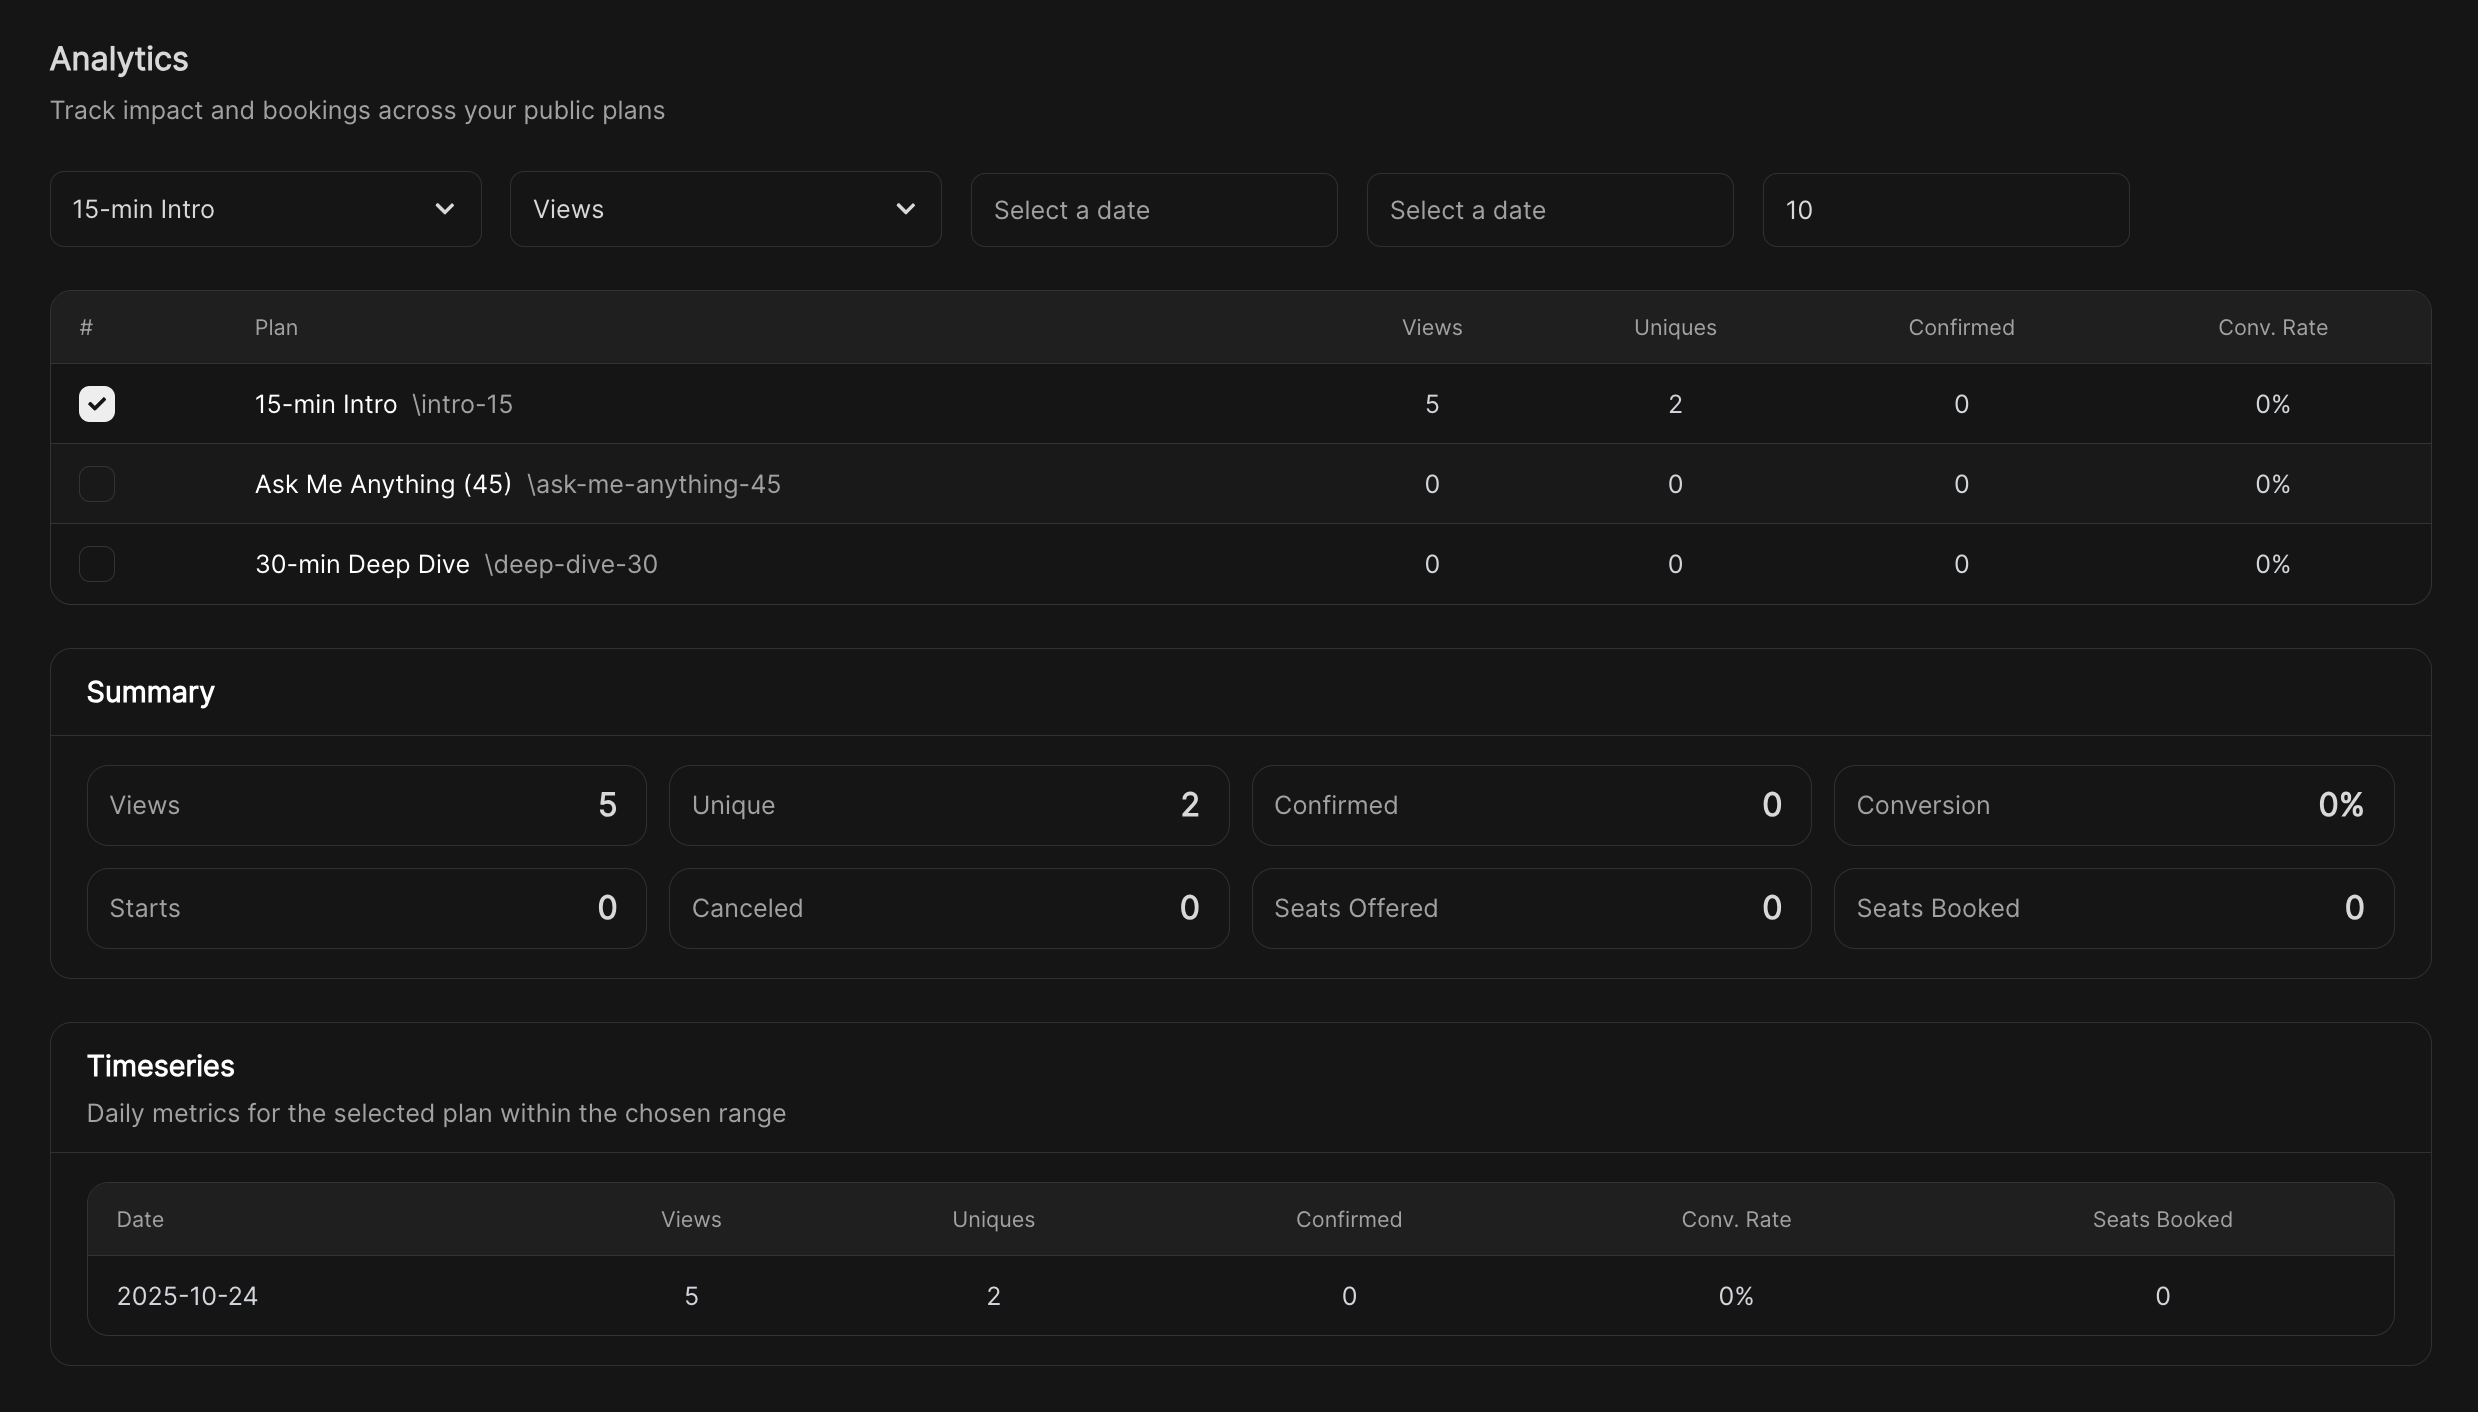
- Plan – Select which workflow you want to analyze.
- Metric – Switch between views, bookings, confirmations, or conversion rates.
- Date range – Choose specific start and end dates to narrow your analysis.
- Limit – Define how many records or days to display.
Plan performance
Each workflow (plan) is displayed in a table with key metrics:- Views – Total times the workflow page was viewed.
- Uniques – Unique visitors who viewed the workflow.
- Confirmed – Number of confirmed bookings.
- Conversion rate – Percentage of visitors who booked.
Summary
A quick snapshot of the selected plan’s performance, showing:- Views – Total page views.
- Unique – Unique visitors.
- Confirmed – Number of confirmed bookings.
- Conversion – Overall conversion rate.
- Starts – How many participants began the workflow.
- Canceled – Number of canceled bookings.
- Seats offered – Total spots made available.
- Seats booked – How many of those spots were filled.
Timeseries
The timeseries section shows daily metrics for the selected workflow within the chosen date range. Each entry includes:- Date – The day the activity was recorded.
- Views – Total views that day.
- Uniques – Unique visitors that day.
- Confirmed – Bookings confirmed.
- Conversion rate – Percentage of visitors who booked.
- Seats booked – Number of seats booked.